Imagine a grocery store where food labels offer a clear, research-backed ranking of healthiness. In several countries, that vision is already a reality.
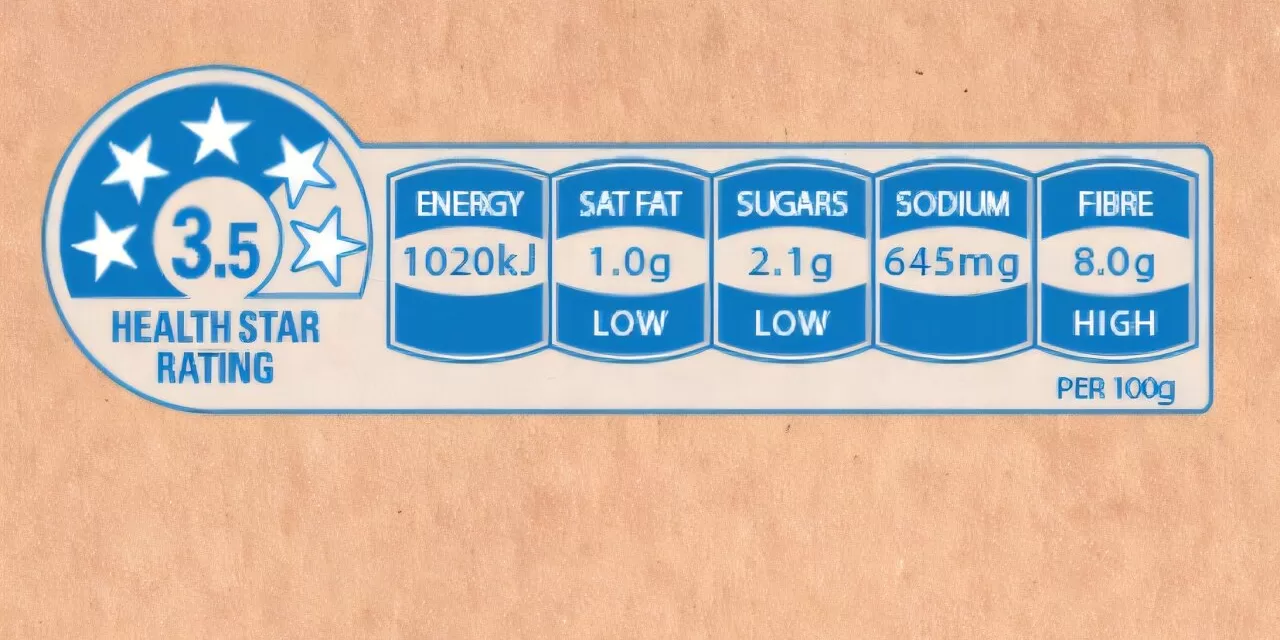
Nutrient profiling systems (NPSs) simplify food choices by assigning health-based scores to grocery items. These systems use algorithms to evaluate a food’s nutrient content and present the results in consumer-friendly formats. France’s Nutri-Score grades foods from A to E with a rainbow-colored scale, Australia’s Health Star Rating awards up to five stars, and the U.K.’s Traffic Light System uses color codes to highlight nutrient levels.
In the U.S., however, such front-of-package rankings remain absent. While the recently developed Food Compass aims to fill the gap, its reliance on complex nutritional data limits its practicality for everyday consumers. Addressing this, a new system called the Nutrient Consume Score (NCS) has emerged, using universally available nutritional information and incorporating factors vital for a healthy microbiome.
How Nutrient Profiling Systems Work
Most NPSs score foods by awarding points for beneficial components like fiber, vitamins, and unsaturated fats while deducting points for overconsumed elements such as sugar, sodium, and saturated fats. The resulting scores enable consumers to quickly compare healthiness between options.
For instance, nutrient-dense kale scores highly for its fiber and potassium content, while a Twinkie, loaded with sugar and saturated fats, ranks poorly. Foods like black olives, which balance fiber with high sodium levels, fall somewhere in between.
Unlike standard Nutrition Facts labels, which require careful interpretation, NPSs distill nutritional data into single, actionable scores, reducing the complexity of choosing healthier foods.
Ranking Processed vs. Unprocessed Foods
Nutrient profiling systems typically favor unprocessed foods—fruits, vegetables, whole grains, nuts, and seeds—while ranking highly processed items like soft drinks and cakes much lower. They complement tools like the NOVA classification system, which categorizes foods by processing levels. While NOVA highlights the health risks of ultra-processed foods, it overlooks differences within this category.
NPSs provide nuance. For example, ultra-processed almond or soy milk with minimal added sugar and salt can earn relatively high scores compared to heavily processed alternatives.
Incorporating Nutrient Ratios
Some NPSs, including NCS, go beyond traditional metrics by incorporating nutrient ratios—such as carbohydrate-to-fiber and sodium-to-potassium—that reflect the natural balance found in unprocessed foods. These ratios correlate with health benefits like improved blood pressure and better metabolic function.
NCS also accounts for bioactive compounds like polyphenols and omega-3 fats, often overlooked by existing systems. By integrating these elements, NCS aims to address gaps in other scoring methods.
The Future of Nutrient Profiling
Despite their promise, NPSs have limitations. They often rely on correlations between nutrient intake and health outcomes rather than proving direct causal relationships. Additionally, individual dietary needs can vary, suggesting that future systems may benefit from personalized algorithms.
Early research shows promise for NCS, linking higher scores to healthier outcomes like lower blood pressure and weight. The system is now being tested through a beta smartphone app, offering a glimpse into how technology could help Americans make smarter food choices.
Empowering Consumers
Countries using front-of-package labels have seen shifts in consumer habits and healthier product innovations. While the U.S. lacks a national system, tools like NCS and smartphone apps could empower consumers to navigate grocery aisles more confidently.
As metabolic diseases rise globally, nutrient profiling systems offer a practical solution to promote healthier eating. With further research and refinement, these tools could pave the way for a healthier future, one food choice at a time.


