
Millions of people living in rural areas worldwide have been systematically excluded from global population datasets, according to a groundbreaking study by Aalto University in Finland. This significant underreporting raises serious concerns about the accuracy of decades’ worth of data that governments, international organizations, and researchers rely on for crucial decision-making.
The study, published in Nature Communications, compared five widely used global population datasets with resettlement figures from over 300 rural dam projects across 35 countries. The results revealed a startling discrepancy: rural populations were underestimated by 53% to 84% over the study period, depending on the dataset.
“For the first time, our study provides evidence that a significant proportion of the rural population may be missing from global population datasets,” said postdoctoral researcher Josias Láng-Ritter from Aalto University. “We were surprised to find that the actual population living in rural areas is much higher than the global population data indicates.”
The researchers turned to dam resettlement data, which provides precise, on-the-ground population counts, to assess the accuracy of the global datasets. “When dams are built, large areas are flooded and people need to be relocated,” explained Láng-Ritter. “The relocated population is usually counted precisely because dam companies pay compensation to those affected.”
The discrepancies were particularly pronounced in countries like China, Brazil, Australia, Poland, and Colombia, where more independent data was available for comparison.
The study identified a key factor contributing to this undercounting: flawed population censuses. Many countries lack the resources for comprehensive rural data collection, and the vast, sparsely populated landscapes make it challenging for census workers to obtain accurate numbers.
Analyzing data from 1975 to 2010, the researchers found that even the 2010 datasets missed between 32% and 77% of rural residents. While accuracy slightly improved over time, newer datasets from 2015 and 2020 are likely to contain similar biases, though dam resettlement data was unavailable for those years.
“While our study shows accuracy has somewhat improved over decades, the trend is clear: global population datasets miss a significant portion of the rural population,” Láng-Ritter stated.
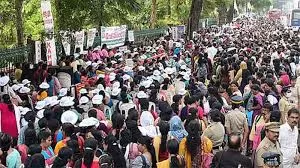
The consequences of this underreporting are profound. About 43% of the world’s 8.2 billion people live in rural areas, and the undercounting could lead to inadequate resource allocation, infrastructure planning, and disaster preparedness. Global decision-makers, including the UN and the World Bank, rely on the same potentially flawed census data, meaning essential services like healthcare and transportation may be insufficiently planned for rural communities.
“In many countries, there may not be sufficient data available on a national level, so they rely on global population maps to support their decision-making,” explained Láng-Ritter. “Do we need an asphalted road or a hospital? How much medicine is required in a particular area? How many people could be affected by natural disasters such as earthquakes or floods?”
The need for accurate rural population data is particularly critical in crisis-hit regions, where transitioning to digital population records could take years. The study emphasizes the urgent need to rethink how rural populations are counted to ensure global datasets reflect reality and prevent these communities from being overlooked in critical planning efforts.
Disclaimer: While the information presented in this article is based on the findings of a published scientific study, it is important to note that scientific research is an ongoing process. Future studies may refine or alter the conclusions presented here. The opinions expressed in this article are those of the researchers involved in the study and do not necessarily reflect the views of any other organization or entity. Readers are encouraged to consult multiple sources and critically evaluate the information presented.


