
NEW DELHI – A comprehensive new analysis of air quality across India has revealed a staggering public health gap: while nearly 44% of Indian cities are trapped in a cycle of chronic air pollution, only a tiny fraction—just 4%—are currently covered by the government’s flagship cleanup initiative.
The report, released this week by the Centre for Research on Energy and Clean Air (CREA), suggests that India’s air quality crisis is not merely a seasonal phenomenon or a series of “bad air days,” but a deep-seated structural failure. By analyzing satellite data and ground-level monitoring, researchers found that 1,787 out of 4,041 cities consistently exceeded national safety standards for fine particulate matter ($PM_{2.5}$) every year between 2019 and 2024.
Despite this widespread toxicity, the National Clean Air Programme (NCAP) currently targets only 130 cities. Even more concerning, only 67 of those 130 cities overlap with the 1,787 cities identified as being in a state of “chronic non-attainment.”
The Geography of Polluted Air: From Assam to Uttar Pradesh
While Delhi often dominates the global headlines for its “gas chamber” winters, the 2025 assessment shows that the crisis has shifted and expanded. The highest annual $PM_{2.5}$ concentration was recorded in Byrnihat, Assam, at $100 \mu g/m^3$—more than double the national annual standard of $40 \mu g/m^3$.
Following Byrnihat are Delhi ($96 \mu g/m^3$) and Ghaziabad ($93 \mu g/m^3$). The “Top 10” list is rounded out by industrial and urban hubs including Noida, Gurugram, Bhiwadi, and Hajipur.
“The data shows us that air pollution is no longer just a ‘big city’ problem or a ‘Delhi’ problem,” says Manoj Kumar, India Analyst at CREA. “It is a national structural issue driven by persistent emission sources like industrial clusters, power plants, and domestic fuel use that remain unaddressed in the vast majority of our urban centers.”
State-Level Crisis
The report identifies Uttar Pradesh as the epicenter of the crisis, leading the country with 416 “non-attainment” cities (cities that fail to meet National Ambient Air Quality Standards). Other hard-hit states include:
-
Rajasthan: 158 cities
-
Gujarat: 152 cities
-
Madhya Pradesh: 143 cities
-
Punjab and Bihar: 136 cities each
The Health Toll: Why $PM_{2.5}$ Matters
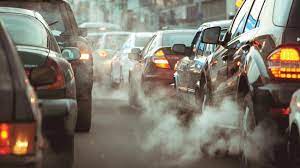
For healthcare professionals and the public, the focus on $PM_{2.5}$ is critical. Unlike larger dust particles ($PM_{10}$), $PM_{2.5}$ particles are small enough to bypass the body’s natural defenses in the nose and throat.
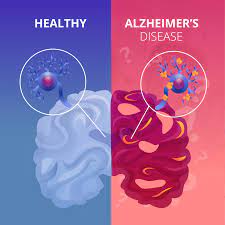
“These particles are less than 2.5 micrometers in diameter—about 30 times thinner than a human hair,” explains Dr. Arvind Kumar, Chairman of the Institute of Chest Surgery at Medanta and a leading advocate for clean air. “When inhaled, they travel deep into the lung alveoli and enter the bloodstream. This triggers systemic inflammation, leading not just to asthma and COPD, but to heart attacks, strokes, and even adverse birth outcomes.”
Research published in The Lancet Planetary Health estimates that air pollution accounts for nearly 1.67 million deaths annually in India. The chronic nature of the pollution identified in the CREA report suggests that millions of citizens are living in a state of “permanent physiological stress.”
Funding Flaws: Dust vs. Combustion
The CREA report also highlights a significant mismatch in how India spends its clean-air budget. Since the inception of the NCAP, approximately ₹13,415 crore has been released, with 74% (₹9,929 crore) utilized.
However, 68% of that spending has been directed toward road dust management (such as mechanical sweepers and water sprinklers). In contrast:
-
Industries: Received less than 1% of funding.
-
Domestic fuel transition: Received less than 1%.
-
Public outreach: Received less than 1%.
Experts argue that while road dust contributes to $PM_{10}$ levels, it is the combustion-based sources—factories, vehicles, and cookstoves—that produce the more lethal $PM_{2.5}$ and toxic gases like $SO_2$ and $NO_x$.
“We are spending the lion’s share of our resources on sweeping dust, which is essentially a cosmetic fix,” says Manoj Kumar. “We need to pivot toward stricter emission standards for industries and an ‘airshed-based’ approach that treats entire regions as one unit, rather than trying to fix the air one city boundary at a time.”
Progress and Pitfalls
The report does offer some glimpses of progress. Twenty-three cities have met the revised 40% reduction target for $PM_{10}$. However, 23 other cities have actually seen their pollution levels increase since the program began.
Furthermore, monitoring infrastructure remains a hurdle. Of the 130 NCAP cities, 28 still lack Continuous Ambient Air Quality Monitoring Stations (CAAQMS), leaving local officials and doctors “flying blind” regarding real-time risks to the population.
What This Means for You
For the average resident in a “non-attainment” city, the CREA findings serve as a reminder that air quality management is a year-round necessity.
-
Monitor Local Levels: Use apps to check the Air Quality Index (AQI) daily, specifically looking for $PM_{2.5}$ levels.
-
Vulnerable Groups: Children, the elderly, and those with pre-existing heart or lung conditions should limit outdoor exertion when AQI exceeds “Moderate” levels.
-
Advocacy: Public health experts encourage citizens to demand that local municipalities move beyond road sprinkling and address localized waste burning and industrial emissions.
As India looks toward its 2030 climate and health goals, the CREA report suggests that a radical expansion of the NCAP is not just a policy recommendation—it is a medical necessity. Without bringing the remaining 96% of chronically polluted cities into the fold, the “Right to Clean Air” will remain a privilege for a few, rather than a reality for all.
References
- https://www.ndtv.com/health/44-indian-cities-face-chronic-air-pollution-only-4-under-national-clean-air-programme-10565683
Medical Disclaimer: This article is for informational purposes only and should not be considered medical advice. Always consult with qualified healthcare professionals before making any health-related decisions or changes to your treatment plan. The information presented here is based on current research and expert opinions, which may evolve as new evidence emerges.


