
NEW DELHI – In a significant move to bolster the nation’s nutritional security and commercial accountability, the Food Safety and Standards Authority of India (FSSAI) has dramatically scaled up its regulatory activities. Following a report presented by Union Minister of State for Health and Family Welfare, Shri Prataprao Jadhav, in the Lok Sabha on March 13, 2026, it was revealed that the agency conducted over 56,000 risk-based inspections over the last three fiscal years.
With more than 5.18 lakh food samples analyzed across States and Union Territories (UTs), the government is signaling a “zero-tolerance” approach toward food adulteration and non-compliance. This expanded oversight comes at a time when consumer awareness regarding food quality and labeling transparency is at an all-time high.
A Data-Driven Approach: The Risk-Based Inspection System (RBIS)
The cornerstone of this regulatory surge is the Risk-Based Inspection System (RBIS). Moving away from arbitrary spot-checks, the FSSAI now utilizes a weighted frequency model where the intensity of oversight is dictated by the inherent risks associated with specific food categories.
According to the latest ministry data, the number of targeted inspections has seen a steady year-on-year incline:
| Financial Year | Total Risk-Based Inspections Conducted |
| 2022-23 | 11,904 |
| 2023-24 | 18,098 |
| 2024-25 | 26,267 |
| Total | 56,269 |
“The shift to a risk-based model is a gold standard in food safety,” says Dr. Aranya Sen, a public health policy consultant not involved in the FSSAI report. “By focusing resources on high-risk sectors—such as dairy, meat, and processed weaning foods—the regulator can prevent large-scale foodborne illness outbreaks before they reach the consumer’s plate.”
Expanding the Testing Infrastructure
To support this massive influx of samples, the FSSAI has fortified India’s diagnostic capabilities. The network now comprises 252 notified food testing laboratories and 24 Referral Food Laboratories for appellate cases.
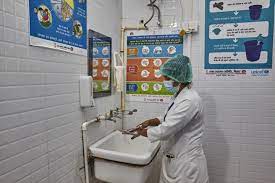
Recognizing that many rural areas lack immediate access to high-end labs, the “Food Safety on Wheels” (FSW) initiative has deployed 305 mobile units across 35 States and UTs. these units are equipped to perform on-the-spot tests for common adulterants in milk, spices, and oils, providing a “lab-at-the-doorstep” service for both enforcement and consumer awareness.
Targeting the “Hidden Killers”: Cooking Oil and Labelling
The FSSAI has introduced stringent measures to tackle two often-overlooked health hazards: the reuse of cooking oil and deceptive labeling.
1. The 25% Threshold for Polar Compounds
Repeated heating of vegetable oil leads to the formation of Total Polar Compounds (TPC), which have been linked to hypertension, atherosclerosis, and Alzheimer’s disease. The FSSAI now mandates that any vegetable oil with a TPC level exceeding 25% must be discarded. Furthermore, Food Business Operators (FBOs) consuming more than 50 liters of oil per day must maintain meticulous disposal records.
2. Transparency in Labeling
The Food Safety and Standards (Labelling and Display) Regulations, 2020 are now being strictly enforced. These regulations require FBOs to provide clear information on allergens, nutritional content, and vegetarian/non-vegetarian status, ensuring that consumers can make informed dietary choices.
Enforcement and Penalties
The implementation of the Food Safety and Standards (FSS) Act, 2006, is a coordinated effort between the Centre and States. Currently, a workforce of 2,997 Food Safety Officers (FSOs) and 668 Designated Officers (DOs) are active at the field level.
Non-compliance has met with swift administrative action. Under Section 32 of the Act, the FSSAI issues Improvement Notices. Failure to rectify identified issues can lead to:
-
Immediate suspension or cancellation of food licenses.
-
Adjudication proceedings and financial penalties.
-
Criminal prosecution in cases of severe gravity (e.g., life-threatening adulteration).
Expert Commentary: The Road Ahead
While the numbers are impressive, independent experts urge caution regarding the depth of these audits. “Quantity must be matched by quality,” notes Vivek Bharadwaj, a food technologist. “Mandatory third-party audits for Central License holders are a great step, but we must ensure these empanelled agencies maintain high integrity and that state labs are consistently upgraded with high-end equipment to detect sophisticated synthetic adulterants.”
Public health advocates also point out that while enforcement is critical, “Eat Right” initiatives in schools and campuses must be scaled alongside inspections to foster a culture of safety from the ground up.
What This Means for Consumers
For the average citizen, these developments offer a safer marketplace, but the FSSAI emphasizes that the public is the “first line of defense.”
How to Protect Yourself:
-
Check the Label: Look for the FSSAI license number on all packaged food.
-
Report Concerns: If you suspect food fraud, use the FoSCoS portal (https://foscos.fssai.gov.in/consumergrievance/) or call the toll-free helpline at 1800-11-2100.
-
Monitor Oil Use: At home, avoid reusing frying oil multiple times, as the domestic kitchen is not exempt from the risks of Total Polar Compounds.
As the FSSAI continues to expand its digital and physical footprint, the goal remains clear: transforming food safety from a reactive regulatory hurdle into a proactive public health priority.
Medical Disclaimer
This article is for informational purposes only and should not be considered medical advice. Always consult with qualified healthcare professionals before making any health-related decisions or changes to your treatment plan. The information presented here is based on current research and expert opinions, which may evolve as new evidence emerges.
References
Official Reports and Statistics:
-
Press Information Bureau (PIB) Delhi. (2026, March 13). Steps taken to Strengthen Food Safety, Food Quality Monitoring and Consumer Protection. Ministry of Health and Family Welfare.
Annexure
| State/UT wise details of Enforcement Samples analysed, found non-conforming and penal action taken during last 03 years | |||||||||||||
| (2024-2025) | (2023-2024) | (2022-2023) | |||||||||||
| S. No. | State/UT | No. of Samples Analysed | Civil Cases | Criminal Cases | Cancelled License | No. of Samples Analysed | Civil Cases | Criminal Cases | Cancelled License | No. of Samples Analysed | Civil Cases | Criminal Cases | Cancelled License |
| Decided with Penalty | No. of Convictions | Decided with Penalty | No. of Convictions | Decided with Penalty | No. of Convictions | ||||||||
| 1 | Andaman And Nicobar Islands | 810 | 0 | 0 | 1 | 0 | 0 | 0 | 0 | 1200 | 58 | 0 | 0 |
| 2 | Andhra Pradesh | 5984 | 464 | 8 | 15 | 6439 | 646 | 8 | 40 | 3607 | 339 | 12 | 64 |
| 3 | Arunachal Pradesh | 125 | 7 | 0 | 5 | 501 | 2 | 0 | 25 | 258 | 0 | 0 | 20 |
| 4 | Assam | 1705 | 0 | 0 | 19 | 1139 | 0 | 0 | 0 | 602 | 0 | 0 | 0 |
| 5 | Bihar | 2863 | 25 | 0 | 7 | 2806 | 79 | 0 | 10 | 2935 | 39 | 0 | 10 |
| 6 | Chandigarh | 374 | 116 | 41 | 5 | 311 | 87 | 52 | 1 | 473 | 27 | 8 | 4 |
| 7 | Chhattisgarh | 2069 | 143 | 6 | 1 | 1373 | 86 | 2 | 0 | 1468 | 119 | 8 | 0 |
| 8 | Dadra and Nagar Haveli & Daman & Diu | 56 | 0 | 0 | 0 | 185 | 0 | 0 | 0 | 164 | 13 | 0 | 0 |
| 9 | Delhi | 2624 | 18 | 16 | 1 | 3412 | 36 | 12 | 1 | 3133 | 86 | 10 | 0 |
| 10 | Goa | 1172 | 11 | 0 | 0 | 599 | 17 | 0 | 1 | 699 | 11 | 0 | 4 |
| 11 | Gujarat | 12387 | 859 | 91 | 8 | 15841 | 1701 | 65 | 7 | 14562 | 547 | 24 | 15 |
| 12 | Haryana | 2233 | 599 | 59 | 20 | 3485 | 593 | 47 | 15 | 4445 | 915 | 35 | 25 |
| 13 | Himachal Pradesh | 1587 | 471 | 0 | 3 | 1618 | 376 | 2 | 6 | 2720 | 93 | 1 | 9 |
| 14 | Jammu & Kashmir | 6955 | 1,239 | 29 | 17 | 9057 | 1612 | 22 | 19 | 13502 | 1592 | 15 | 42 |
| 15 | Jharkhand | 364 | 52 | 0 | 1 | 384 | 59 | 0 | 2 | 943 | 44 | 8 | 1 |
| 16 | Karnataka | 9371 | 283 | 32 | 34 | 5492 | 75 | 16 | 50 | 3416 | 191 | 15 | 56 |
| 17 | Kerala | 10767 | 1,088 | 206 | 40 | 10792 | 854 | 134 | 137 | 8533 | 454 | 33 | 90 |
| 18 | Ladakh | 417 | 38 | 0 | 0 | 638 | 19 | 0 | 1 | 220 | 23 | 0 | 0 |
| 19 | Lakshadweep | 0 | 0 | 0 | 0 | 0 | 0 | 0 | 0 | 0 | 0 | 0 | 0 |
| 20 | Madhya Pradesh | 13920 | 2,597 | 22 | 3 | 13998 | 1938 | 46 | 10 | 12507 | 1908 | 71 | 22 |
| 21 | Maharashtra | 5403 | 1,147 | 0 | 9 | 5087 | 154 | 0 | 4 | 11077 | 198 | 5 | 17 |
| 22 | Manipur | 126 | 2 | 0 | 1 | 168 | 0 | 0 | 0 | 169 | 0 | 0 | 3 |
| 23 | Meghalaya | 388 | 0 | 0 | 0 | 123 | 0 | 0 | 0 | 409 | 0 | 0 | 0 |
| 24 | Mizoram | 0 | 0 | 0 | 0 | 0 | 0 | 0 | 0 | 140 | 0 | 0 | 0 |
| 25 | Nagaland | 223 | 0 | 0 | 0 | 138 | 3 | 0 | 1 | 109 | 0 | 0 | 1 |
| 26 | Orissa | 2282 | 27 | 0 | 2 | 2003 | 0 | 0 | 24 | 1368 | 47 | 0 | 40 |
| 27 | Puducherry | 173 | 0 | 0 | 0 | 31 | 0 | 0 | 0 | 0 | 0 | 0 | 1 |
| 28 | Punjab | 4131 | 333 | 8 | 1 | 6041 | 1204 | 102 | 0 | 8179 | 1404 | 5 | 1 |
| 29 | Rajasthan | 13840 | 3,114 | 30 | 2 | 18536 | 2181 | 12 | 0 | 13184 | 2435 | 4 | 1 |
| 30 | Sikkim | 254 | 0 | 0 | 0 | 231 | 0 | 0 | 0 | 279 | 4 | 0 | 0 |
| 31 | Tamil Nadu | 18071 | 1,536 | 492 | 7 | 18146 | 2195 | 478 | 36 | 24188 | 3714 | 678 | 47 |
| 32 | Telangana | 3347 | 125 | 0 | 1 | 6156 | 425 | 0 | 6 | 4809 | 315 | 0 | 9 |
| 33 | Tripura | 123 | 0 | 0 | 0 | 87 | 0 | 0 | 0 | 31 | 0 | 0 | 0 |
| 34 | Uttar Pradesh | 30380 | 14,920 | 215 | 16 | 27750 | 14627 | 163 | 9 | 30140 | 13148 | 251 | 50 |
| 35 | Uttarakhand | 1509 | 256 | 4 | 1 | 1998 | 332 | 0 | 1 | 1839 | 507 | 5 | 1 |
| 36 | West Bengal | 14502 | 672 | 6 | 0 | 5948 | 285 | 0 | 2 | 6203 | 233 | 0 | 0 |
| Total | 170535 | 30142 | 1265 | 220 | 170513 | 29586 | 1161 | 408 | 177511 | 28464 | 1188 | 533 | |


