As per the report released by the National Family Health Survey-4 (2015-16), conducted by the Ministry of Health & Family Welfare, the prevalence of undernutrition among women is 22.9% as compared to males (20.2%), which is an improvement from the levels of 35.5% and 34.2% respectively reported in National Family Health Survey-3 conducted in 2005-06. The State/UT wise prevalence of undernutrition among women and men is at Annexure I.
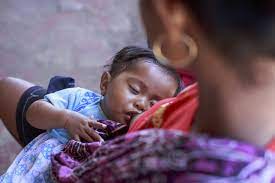
Women are at greater risk of malnutrition due to the increased nutritional needs associated with menstruation, pregnancy, and lactation. Women are also more exposed to risk factors for malnutrition such as HIV/AIDS, food insecurity and poverty. The nutritional status of women has major implications on the well-being and nutrition of all family members. The determinants of malnutrition are often intrinsically related to gender dynamics in households and communities. Improving gender dynamics is thus a necessity to prevent malnutrition.
The data on nutritional indicators is captured under the National Family Health Surveys conducted periodically by the Ministry of Health & Family Welfare, with International Institute for Population Sciences (IIPS) being the nodal agency for conducting the surveys using a standardized methodology.
To ensure consistent and accurate recording and reporting of the critical programme data, the Ministry has initiated efforts towards quality data collection, analysis for differential planning and supervision for improved action at the community level as part of strengthening and systems quality improvement via ICT-based application, Poshan Tracker. The Poshan Tracker is built on the latest technology for ensuring real-time monitoring and providing real-time information relating to various parameters of service delivery and malnutrition under Mission Poshan 2.0.
Government implements Anganwadi Services Scheme, POSHAN Abhiyaan, Pradhan Mantri Matru Vandana Yojana and Scheme for Adolescent Girls under the Umbrella Integrated Child Development Services Scheme (ICDS) as targeted interventions for children up to the age of 6 years, Pregnant Women and Lactating Mothers and Adolescent Girls, throughout the country. POSHAN Abhiyaan aims to reduce malnutrition in a phased manner, through a life cycle approach, by adopting a synergised and result-oriented approach. Target is to bring down stunting of children under 6 years from 38.4% to 25% by the year 2022. All these schemes address in one or other aspects related to nutrition and have the potential to improve nutritional outcomes in the country.
For alleviation of malnutrition, the Government has announced Mission Poshan 2.0 to strengthen nutritional content, delivery, outreach and outcomes with focus on developing practices that nurture health, wellness and immunity to disease and malnutrition.
For greater transparency, accountability and quality in the nutrition support programme and service delivery, streamlined guidelines dated 13.1.2021 have been issued to States/UTs. These guidelines emphasize on ensuring the quality of supplementary nutrition, highlights roles and responsibilities of duty holders, IT-enabled data management and monitoring, leveraging of traditional knowledge through AYUSH, procurement and convergence for achieving good nutritional outcomes.
Annexure I
State-wise prevalence of undernutrition among women and men aged 15-49 years, NFHS-4, 2015-16
| SN | States | Women whose Body
Mass Index (BMI) is below normal (BMI <18.5 kg/m2) (%) * |
Men whose Body
Mass Index (BMI) is below normal (BMI <18.5 kg/m2) (%) |
| 1 | Andaman & Nicobar Islands | 13.1 | 8.7 |
| 2 | Andhra Pradesh | 17.6 | 14.8 |
| 3 | Arunachal Pradesh | 8.5 | 8.3 |
| 4 | Assam | 25.7 | 20.7 |
| 5 | Bihar | 30.4 | 25.4 |
| 6 | Chandigarh | 13.3 | 21.7 |
| 7 | Chhattisgarh | 26.7 | 24.1 |
| 8 | Dadra & Nagar Haveli & Daman & Diu | 23.4 | 16.3 |
| 9 | Delhi | 14.9 | 17.7 |
| 10 | Goa | 14.7 | 10.8 |
| 11 | Gujarat | 27.2 | 24.7 |
| 12 | Haryana | 15.8 | 11.3 |
| 13 | Himachal Pradesh | 16.2 | 18 |
| 14 | Jammu & Kashmir | 12.2 | 11.5 |
| 15 | Jharkhand | 31.5 | 23.8 |
| 16 | Karnataka | 20.7 | 16.5 |
| 17 | Kerala | 9.7 | 8.5 |
| 18 | Ladakh | 10.5 | 11.2 |
| 19 | Lakshadweep | 13.5 | 8.2 |
| 20 | Madhya Pradesh | 28.4 | 28.4 |
| 21 | Maharashtra | 23.5 | 19.1 |
| 22 | Manipur | 8.8 | 11.1 |
| 23 | Meghalaya | 12.1 | 11.6 |
| 24 | Mizoram | 8.4 | 7.3 |
| 25 | Nagaland | 12.3 | 11.5 |
| 26 | Orissa | 26.5 | 19.5 |
| 27 | Puducherry | 11.2 | 10.2 |
| 28 | Punjab | 11.7 | 10.9 |
| 29 | Rajasthan | 27 | 22.7 |
| 30 | Sikkim | 6.4 | 2.4 |
| 31 | Tamil Nadu | 14.6 | 12.4 |
| 32 | Telangana | 22.9 | 21.5 |
| 33 | Tripura | 18.9 | 15.7 |
| 34 | Uttar Pradesh | 25.3 | 25.9 |
| 35 | Uttarakhand | 18.4 | 16.1 |
| 36 | West Bengal | 21.3 | 19.9 |
*Excludes pregnant women and women with a birth in the preceding 2 month.

