A centrally sponsored scheme for setting up of 1023 Fast Track Special Courts (FTSCs) including 389 Exclusive POCSO Courts is implemented by the Department of Justice(DoJ), for expeditious trial and disposal of rape and POCSO cases. As informed by DoJ, 640 FTSCs including 338 exclusive POCSO Courts have become functional in 26 States/UTs by May 2021.
As per the latest NCRB report 2019, the State/UT Wise CASES REGISTERED (CR), CASES CHARGESHEETED (CCS), CASES CONVICTED (CON) and CONVICTION RATE (CVR) under Protection off Children from Sexual Offences (POCSO) Act, 2012 during 2017-2019 is annexed. There has been an increase in Conviction Rate over this period. As informed by National Crime Records Bureau(NCRB), the reasons for the majority of child sexual abuse cases being ending in an acquittal are not maintained separately.
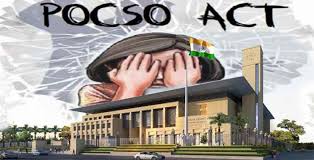
The Protection of Children from Sexual Offences (POCSO) Act, 2012 enacted by Govt of India provides safeguards for children against sexual abuse. The Act was amended in 2019 to introduce more stringent punishment including the death penalty for committing sexual crimes on children, with a view to deter the perpetrators & prevent such crimes against children.
Section 43 of the POCSO Act, 2012 provides that the Central Government and every State Government shall take all measures to give wide publicity to the provisions of the Act. In accordance with this, the Government has taken various steps from time to time to create awareness of the provisions of the POCSO Act through electronic and print media, consultations, workshops and training programmes with stakeholders concerned.
Further, the Ministry of Women & Child Development notified new POCSO Rules, 2020 replacing the previous POCSO Rules, 2012. The POCSO Rules 2020 stipulate that the central government and every state government shall prepare age-appropriate educational material and curriculum for children, informing them about various aspects of personal safety. The Rules also stipulates that suitable material and information may be disseminated by the respective Governments in all public places such as panchayat bhavans, community centers, schools and colleges, bus terminals, railway stations, places of congregation, airports, taxi stands, cinema halls and such other prominent places and also be disseminated in suitable form in virtual spaces such as internet and social media.
AS ANNEXURE
| 2017 | 2018 | 2019 | |||||||||||
| S.NO | STATES/UTS | CR | CCS | CON | CVR | CR | CCS | CON | CVR | CR | CCS | CON | CVR |
| 1 | Andhra Pradesh | 378 | 295 | 8 | 9.3 | 361 | 338 | 6 | 6.5 | 502 | 313 | 16 | 16.2 |
| 2 | Arunachal Pradesh | 14 | 4 | 0 | – | 24 | 23 | 1 | 50.0 | 36 | 24 | 0 | – |
| 3 | Assam | 1149 | 733 | 52 | 31.1 | 1721 | 1486 | 69 | 21.6 | 1779 | 1396 | 83 | 26.8 |
| 4 | Bihar | 1356 | 809 | 34 | 49.3 | 2094 | 1273 | 104 | 71.2 | 1540 | 1184 | 113 | 67.7 |
| 5 | Chhattisgarh | 1676 | 1576 | 345 | 34.2 | 1812 | 1657 | 310 | 34.0 | 2027 | 2073 | 349 | 30.7 |
| 6 | Goa | 0 | 0 | 0 | – | 2 | 2 | 0 | – | 0 | 0 | 0 | – |
| 7 | Gujarat | 1697 | 1712 | 12 | 9.8 | 2154 | 2066 | 33 | 13.5 | 2253 | 2072 | 74 | 17.9 |
| 8 | Haryana | 1139 | 941 | 183 | 31.3 | 1924 | 1597 | 296 | 35.7 | 2074 | 1686 | 333 | 30.7 |
| 9 | Himachal Pradesh | 8 | 12 | 1 | 100.0 | 28 | 23 | 0 | 0.0 | 12 | 8 | 0 | 0.0 |
| 10 | Jammu & Kashmir | 0 | 0 | 0 | – | 32 | 24 | 0 | – | 109 | 79 | 0 | 0.0 |
| 11 | Jharkhand | 385 | 230 | 17 | 37.8 | 615 | 391 | 38 | 29.5 | 654 | 459 | 100 | 56.2 |
| 12 | Karnataka | 1956 | 1975 | 122 | 20.0 | 2036 | 2165 | 174 | 19.4 | 2160 | 2021 | 190 | 18.9 |
| 13 | Kerala | 1169 | 892 | 33 | 32.0 | 1153 | 964 | 77 | 36.0 | 1283 | 1009 | 40 | 19.4 |
| 14 | Madhya Pradesh | 1569 | 1510 | 284 | 31.4 | 2445 | 2692 | 488 | 39.4 | 6123 | 5867 | 874 | 30.1 |
| 15 | Maharashtra | 5248 | 4507 | 498 | 27.1 | 6233 | 5269 | 525 | 28.6 | 6558 | 6295 | 706 | 28.9 |
| 16 | Manipur | 29 | 32 | 3 | 100.0 | 43 | 26 | 4 | 100.0 | 58 | 59 | 5 | 100.0 |
| 17 | Meghalaya | 242 | 151 | 5 | 83.3 | 266 | 174 | 16 | 59.3 | 219 | 255 | 96 | 84.2 |
| 18 | Mizoram | 194 | 186 | 48 | 69.6 | 138 | 171 | 27 | 87.1 | 79 | 78 | 59 | 88.1 |
| 19 | Nagaland | 41 | 37 | 9 | 64.3 | 9 | 13 | 9 | 81.8 | 12 | 12 | 1 | 50.0 |
| 20 | Odisha | 249 | 436 | 11 | 5.1 | 1887 | 1468 | 24 | 18.8 | 2036 | 1779 | 33 | 25.6 |
| 21 | Punjab | 489 | 384 | 60 | 23.5 | 411 | 354 | 82 | 35.3 | 389 | 319 | 87 | 31.3 |
| 22 | Rajasthan | 1180 | 905 | 89 | 44.1 | 488 | 396 | 102 | 45.5 | 596 | 423 | 178 | 60.3 |
| 23 | Sikkim | 87 | 93 | 19 | 65.5 | 118 | 112 | 25 | 39.7 | 91 | 88 | 12 | 40.0 |
| 24 | Tamil Nadu | 1587 | 1642 | 154 | 19.6 | 2039 | 2192 | 275 | 23.1 | 2396 | 2228 | 286 | 25.4 |
| 25 | Telangana | 1632 | 1061 | 31 | 10.3 | 1665 | 1376 | 69 | 12.5 | 1998 | 1724 | 89 | 8.7 |
| 26 | Tripura | 139 | 132 | 19 | 44.2 | 127 | 145 | 13 | 26.0 | 176 | 173 | 34 | 38.2 |
| 27 | Uttar Pradesh | 4895 | 4079 | 819 | 72.3 | 5401 | 4401 | 780 | 63.5 | 7594 | 6478 | 1002 | 62.5 |
| 28 | Uttarakhand | 191 | 146 | 17 | 81.0 | 337 | 213 | 24 | 66.7 | 369 | 384 | 92 | 90.2 |
| 29 | West Bengal | 2131 | 1723 | 39 | 18.0 | 2267 | 2403 | 90 | 28.9 | 2267 | 2403 | 90 | 28.9 |
| TOTAL STATE(S) | 30830 | 26203 | 2912 | 33.0 | 37830 | 33414 | 3661 | 33.4 | 45390 | 40889 | 4942 | 32.7 | |
| 30 | A&N Islands | 65 | 75 | 1 | 4.2 | 69 | 74 | 0 | 0.0 | 94 | 87 | 3 | 9.7 |
| 31 | Chandigarh | 3 | 2 | 0 | 0.0 | 2 | 2 | 1 | 100.0 | 5 | 6 | 0 | – |
| 32 | D&N Haveli | 12 | 6 | 3 | 23.1 | 21 | 17 | 1 | 8.3 | 39 | 44 | 0 | 0.0 |
| 33 | Daman & Diu | 5 | 3 | 0 | – | 3 | 8 | 3 | 60.0 | 15 | 10 | 0 | 0.0 |
| 34 | Delhi | 1623 | 1714 | 104 | 46.2 | 1839 | 1994 | 218 | 59.1 | 1719 | 1589 | 718 | 68.4 |
| 35 | Lakshadweep | 4 | 4 | 0 | – | 7 | 7 | 0 | – | 25 | 11 | 0 | 0.0 |
| 36 | Puducherry | 66 | 56 | 0 | – | 56 | 52 | 0 | 0.0 | 48 | 45 | 4 | 100.0 |
| TOTAL UT(S) | 1778 | 1860 | 108 | 41.1 | 1997 | 2154 | 223 | 56.7 | 1945 | 1792 | 725 | 64.9 | |
| TOTAL (ALL INDIA) | 32608 | 28063 | 3020 | 33.2 | 39827 | 35568 | 3884 | 34.2 | 47335 | 42681 | 5667 | 34.9 | |
| Source: Crime in India | ||||||
| Note : Due to non-receipt of data from West Bengal in time for 2019, Data furnished for 2018 has been used | ||||||


