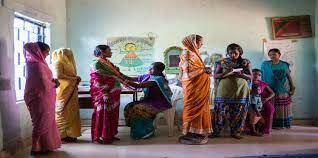
The healthcare system of the country involves a three-tier system with Sub Health Centre (Rural), Primary Health Centre (Urban and Rural) and Community Health Centre (Urban and Rural) as the three pillars of Primary Health Care System in India.
As per established norms, in rural areas a Sub Health Centre for a population of 5,000 (in plain) and 3000 (in hilly and tribal area), a Primary Health Centre for a population of 30,000 (in plains) and 20,000 (in hilly and tribal areas) and Community Health Centre for a population of 1,20,000 (in plain) and 80,000 (in hilly and tribal area) is sugessted. Further, for urban area one Urban Health Wellness Centre is recommended for a urban population of 15,000 to 20,000, one U-PHC for a urban population of 30,000 to 50,000, One U-CHC for every 2.5 lakh population in non-metro cities (above 5 lakh population) and one U-CHC for every 5 lakh population in the metro cities. Further, District Hospital (DH), Sub-District Hospital (SDH) and First Referral Unit provide secondary care services for rural & urban area.
Rural Health Statistics (RHS) is an annual publication, based on Health care administrative data reported by States/UTs. Details of State/UT-wise number of Sub-Centres, PHCs, CHCs, Sub-Divisional Hospital, District Hospital & Medical Colleges functioning in rural & urban areas along with details of average population covered by rural health centre may be seen at the following link of RHS 2021-22:
National Health Mission (NHM) envisages achievement of universal access to equitable, affordable & quality health care services that are accountable and responsive to people’s needs. The Ministry of Health and Family Welfare provides technical and financial support to the States/UTs to strengthen the public healthcare system, based on the proposals received in the form of Programme Implementation Plans (PIPs) under National Health Mission. Government of India provides approval for the proposals in the form of Record of Proceedings (RoPs) as per norms & available resources.
The number of rural healthcare centres functioning in the country, State/UT-wise may be seen at the following link of RHS 2021-22:
State/UT wise Central Releases and Expenditure under NHM for various activities including health facilities during last five years is at Annexure-I.
State/UT wise approval and expenditure on infrastructure strengthening under NHM from Financial Year 2020-21 to Financial Year 2022-23 is attached at Annexure-II.
The Union Minister of State for Health and Family Welfare, Dr Bharati Pravin Pawar stated this in a written reply in the Lok Sabha yesterday.
Annexure-I
| State/UT-wise Central Release and Expenditure under National Health Mission (NHM) from FY 2018-19 to FY 2022-23 |
|||||||||||
| Rs. in Lakhs | |||||||||||
| Sl. No. | States | 2018-19 | 2019-20 | 2020-21 | 2021-22 | 2022-23 | |||||
| Central Release | Expenditure | Central Release | Expenditure | Central Release | Expenditure | Central Release | Expenditure | Central Release | Expenditure | ||
| 1 | Andaman and Nicobar Islands | 18.05 | 41.49 | 34.92 | 41.66 | 36.91 | 42.68 | 43.68 | 31.20 | 45.26 | 42.28 |
| 2 | Andhra Pradesh | 1,081.29 | 1,658.07 | 1,111.07 | 1,820.15 | 1,097.81 | 2,385.48 | 1,199.37 | 2,448.67 | 1,489.45 | 1,914.34 |
| 3 | Arunachal Pradesh | 216.92 | 168.74 | 185.95 | 186.21 | 243.04 | 209.06 | 188.53 | 248.51 | 233.82 | 424.78 |
| 4 | Assam | 1,381.51 | 1,571.54 | 1,749.24 | 1,856.33 | 1,807.48 | 1,846.86 | 1,955.93 | 2,194.36 | 1,981.83 | 2,307.00 |
| 5 | Bihar | 1,409.78 | 1,788.82 | 1,510.68 | 2,842.26 | 1,814.63 | 2,415.34 | 1,748.76 | 1,905.35 | 1,586.57 | 3,717.81 |
| 6 | Chandigarh | 27.06 | 30.42 | 22.77 | 20.97 | 22.21 | 19.52 | 17.47 | 26.86 | 38.09 | 26.98 |
| 7 | Chhattisgarh | 875.10 | 1,138.90 | 816.07 | 1,464.47 | 979.41 | 1,521.30 | 969.61 | 1,833.45 | 1,195.08 | 2,152.45 |
| 8 | Dadra & Nagar Haveli | 23.46 | 23.15 | 25.33 | 23.67 | 36.39 | 35.74 | 38.59 | 45.02 | 58.28 | 41.61 |
| Daman & Diu | 11.76 | 14.67 | 16.79 | 11.36 | |||||||
| 9 | Delhi | 154.23 | 156.47 | 138.74 | 173.28 | 125.73 | 210.83 | 127.37 | 237.79 | 35.15 | 298.11 |
| 10 | Goa | 33.96 | 46.23 | 35.47 | 58.47 | 34.81 | 67.43 | 26.01 | 60.56 | 55.42 | 84.64 |
| 11 | Gujarat | 1,038.69 | 1,793.63 | 1,110.80 | 1,864.73 | 1,005.66 | 1,894.46 | 1,094.48 | 1,835.81 | 1,120.06 | 2,292.35 |
| 12 | Haryana | 538.83 | 705.96 | 567.71 | 792.64 | 531.50 | 829.12 | 577.07 | 879.91 | 681.21 | 1,185.43 |
| 13 | Himachal Pradesh | 345.43 | 441.38 | 504.84 | 469.60 | 441.94 | 425.58 | 555.09 | 525.09 | 494.65 | 567.83 |
| 14 | Jammu and Kashmir | 556.46 | 573.12 | 702.20 | 662.56 | 667.46 | 657.53 | 459.10 | 779.61 | 651.52 | 917.02 |
| 15 | Jharkhand | 616.23 | 1,039.07 | 830.63 | 1,090.11 | 602.80 | 999.71 | 640.18 | 1,176.55 | 810.30 | 1,495.17 |
| 16 | Karnataka | 1,254.82 | 1,942.61 | 1,173.77 | 2,384.28 | 1,232.19 | 2,320.37 | 1,274.71 | 2,200.92 | 1,246.67 | 2,376.94 |
| 17 | Kerala | 887.90 | 1,074.25 | 836.14 | 1,023.94 | 788.22 | 1,457.75 | 771.47 | 1,230.96 | 1,036.76 | 1,592.96 |
| 18 | Lakshadweep | 6.58 | 5.85 | 6.16 | 6.55 | 7.11 | 6.99 | 8.41 | 7.26 | 9.97 | 9.29 |
| 19 | Madhya Pradesh | 1,668.09 | 2,531.87 | 1,728.73 | 3,102.89 | 2,377.14 | 3,397.82 | 2,295.66 | 3,714.92 | 2,582.10 | 4,489.15 |
| 20 | Maharashtra | 1,565.98 | 2,714.86 | 1,724.99 | 3,097.08 | 1,833.59 | 3,503.62 | 1,769.67 | 4,227.31 | 2,187.13 | 4,501.75 |
| 21 | Manipur | 147.09 | 146.46 | 185.65 | 196.06 | 189.49 | 112.79 | 95.59 | 154.09 | 61.40 | 214.69 |
| 22 | Meghalaya | 145.06 | 159.81 | 141.17 | 166.24 | 202.63 | 213.36 | 282.46 | 227.08 | 261.56 | 319.08 |
| 23 | Mizoram | 118.36 | 125.46 | 127.24 | 105.70 | 143.73 | 131.36 | 93.82 | 153.16 | 111.82 | 135.33 |
| 24 | Nagaland | 132.11 | 142.55 | 123.23 | 130.37 | 188.21 | 159.72 | 126.66 | 192.16 | 91.38 | 161.93 |
| 25 | Odisha | 743.57 | 1,673.91 | 1,475.14 | 2,220.82 | 1,617.63 | 2,347.24 | 1,263.07 | 2,587.72 | 1,284.69 | 3,402.50 |
| 26 | Puducherry | 38.16 | 40.13 | 31.56 | 44.21 | 25.55 | 47.32 | 21.33 | 46.36 | 20.73 | 48.51 |
| 27 | Punjab | 570.51 | 739.07 | 712.02 | 923.31 | 568.14 | 908.98 | 349.21 | 918.96 | 448.89 | 1,054.39 |
| 28 | Rajasthan | 1,667.00 | 2,309.53 | 1,781.83 | 2,559.51 | 2,000.58 | 2,943.21 | 1,924.95 | 3,230.01 | 1,460.80 | 3,726.21 |
| 29 | Sikkim | 45.22 | 59.38 | 53.55 | 54.84 | 70.13 | 52.06 | 51.86 | 46.06 | 73.30 | 88.69 |
| 30 | Tamil Nadu | 1,479.71 | 2,533.41 | 1,424.22 | 2,557.62 | 1,522.71 | 2,172.33 | 1,631.91 | 3,039.39 | 1,652.24 | 3,191.84 |
| 31 | Telangana | 713.43 | 1,078.70 | 964.34 | 949.96 | 671.88 | 1,354.93 | 725.67 | 1,556.65 | 683.77 | 2,062.93 |
| 32 | Tripura | 186.52 | 199.86 | 239.47 | 208.37 | 225.91 | 249.74 | 217.95 | 237.24 | 231.90 | 287.20 |
| 33 | Uttar Pradesh | 3,886.70 | 6,871.79 | 4,749.05 | 7,453.90 | 3,772.95 | 7,080.45 | 3,235.46 | 6,210.20 | 5,133.59 | 8,828.29 |
| 34 | Uttarakhand | 297.18 | 491.87 | 348.83 | 504.02 | 583.25 | 503.53 | 553.47 | 606.07 | 505.01 | 647.13 |
| 35 | West Bengal | 1,116.09 | 2,236.34 | 1,749.32 | 2,340.84 | 1,895.01 | 2,598.62 | 1,654.26 | 2,229.46 | 1,252.32 | 3,509.86 |
| 36 | Ladakh | – | – | – | – | 91.89 | 38.56 | 44.79 | 62.81 | 94.95 | 109.67 |
| Note:
1. The above releases relate to Central Govt. Grants & do not include State share contribution. 2. Expenditure includes expenditure against Central Release, State share & unspent balances at the beginning of the year. 3. Expenditures are as per FMR reported by State/UTs and are Provisional. 4. After the reorganisation of the State of Jammu and Kashmir (J&K) into the Union Territory of J&K and Union Territory of Ladakh, NHM funds to the UT of Ladakh were disbursed for the first time during 2020-21. |
|||||||||||
Annexure-II
| State-wise SPIP and Expenditure on Infrastructure Strengthening under National Health Mission (NHM) from FY 2020-21 to FY 2022-23 |
|||||||
| Rs. in Lakhs | |||||||
| Sl. No. | States | 2020-21 | 2021-22 | 2022-23 | |||
| SPIP Approvals | Expenditure | SPIP Approvals | Expenditure | SPIP Approvals | Expenditure | ||
| 1 | Andaman and Nicobar Islands | 133.00 | 59.76 | 159.00 | 2.52 | 2.00 | 3.70 |
| 2 | Andhra Pradesh | 14,399.00 | 44,164.00 | 2,332.75 | 2,462.75 | – | – |
| 3 | Arunachal Pradesh | 2,828.89 | 1,893.17 | 5,634.45 | 4,386.79 | 4,727.02 | 6,559.11 |
| 4 | Assam | 32,971.23 | 18,041.83 | 23,372.48 | 15,506.43 | 35,806.76 | 9,406.43 |
| 5 | Bihar | 36,045.62 | 22,938.18 | 37,358.15 | 12,848.02 | 98,944.23 | 35,877.90 |
| 6 | Chandigarh | – | – | – | – | – | – |
| 7 | Chhattisgarh | 14,343.63 | 10,010.36 | 14,665.83 | 3,809.60 | 7,549.77 | 6,767.11 |
| 8 | Dadra & Nagar Haveli and Daman & Diu | 5.76 | 2.39 | 2.88 | – | 2.88 | – |
| 9 | Delhi | – | 0.62 | 500.00 | 34.31 | – | 257.53 |
| 10 | Goa | 115.80 | 12.85 | 124.75 | 54.06 | 232.06 | 108.66 |
| 11 | Gujarat | 1,075.17 | 1,096.30 | 675.30 | 328.43 | 4,599.10 | – |
| 12 | Haryana | 16,762.37 | 803.45 | 12,613.42 | 611.35 | 8,295.83 | 8,719.42 |
| 13 | Himachal Pradesh | 8,731.00 | 3,067.99 | 3,547.39 | 3,149.75 | – | – |
| 14 | Jammu and Kashmir | 4,363.21 | 2,086.11 | 3,368.53 | 560.09 | 1,535.16 | 451.73 |
| 15 | Jharkhand | 10,493.20 | 4,948.99 | 2,352.00 | 2,370.65 | 9,200.00 | 3,645.07 |
| 16 | Karnataka | 16,083.05 | 20,908.13 | 15,103.25 | 15,441.70 | 7,113.93 | 4,917.32 |
| 17 | Kerala | 10,734.71 | 6,156.16 | 5,837.16 | 4,472.99 | 12,632.88 | 5,270.20 |
| 18 | Lakshadweep | – | – | – | – | – | – |
| 19 | Madhya Pradesh | 53,115.51 | 29,182.37 | 22,886.44 | 13,001.87 | 18,058.74 | 21,048.57 |
| 20 | Maharashtra | 47,508.02 | 39,002.64 | 54,147.40 | 20,219.84 | 58,844.37 | 23,395.90 |
| 21 | Manipur | 2,602.17 | 262.77 | 2,858.45 | 680.94 | 1,779.93 | 44.62 |
| 22 | Meghalaya | 1,282.00 | 628.34 | 1,609.04 | 209.92 | 1,002.97 | 755.75 |
| 23 | Mizoram | 557.00 | 205.91 | 18.00 | 4.30 | 3.30 | 3.30 |
| 24 | Nagaland | 3,855.33 | 557.28 | 1,005.04 | 1,367.04 | 3,068.98 | 1,110.37 |
| 25 | Odisha | 20,665.69 | 35,920.28 | 32,219.80 | 34,479.62 | 60,725.53 | 81,628.87 |
| 26 | Puducherry | 4.00 | 116.60 | 22.80 | – | – | 5.44 |
| 27 | Punjab | 8,925.00 | 6,541.42 | 5,141.90 | 3,499.20 | 799.50 | 21.32 |
| 28 | Rajasthan | 94,252.62 | 31,238.99 | 82,158.82 | 13,969.16 | 55,662.72 | 26,254.00 |
| 29 | Sikkim | 376.68 | 360.78 | 371.20 | 224.27 | 31.17 | 5.30 |
| 30 | Tamil Nadu | 32,950.88 | 30,750.18 | 24,531.73 | 26,263.31 | 51,962.61 | 38,407.81 |
| 31 | Telangana | 13,970.07 | 9,798.65 | 7,512.13 | 12,838.82 | 11,386.59 | 15,419.39 |
| 32 | Tripura | 4,491.00 | 3,426.15 | 4,874.00 | 4,206.21 | 4,828.00 | 4,080.46 |
| 33 | Uttar Pradesh | 144,397.66 | 25,405.50 | 122,539.96 | 11,687.43 | 37,590.00 | 17,040.72 |
| 34 | Uttarakhand | 10,428.68 | 7,933.71 | 12,955.74 | 14,889.74 | 9,544.10 | 4,820.47 |
| 35 | West Bengal | 17,727.50 | 10,424.84 | 7,851.58 | 1,604.29 | 9,298.13 | 612.80 |
| 36 | Ladakh | 3,240.67 | 518.06 | 3,125.00 | 470.95 | 2,680.95 | 1,215.87 |
| Note:
1. Expenditure includes expenditure against Central Release, State share & unspent balances at the beginning of the year. 2. The Above Figures are as per FMR reported by State/UTs and are Provisional. |
|||||||


